HASS: From Concept to Completion
When a manufacturer of power conditioning equipment wanted to determine why products were experiencing a major failure mode in the field, he contacted one of QualMark’s Accelerated Reliability Test Centers (ARTC) for help. A HASS process was proposed and implemented to provide a solution.
The goal of HASS is to develop a screen that is effective in causing latent failures to become actual failures without removing a significant amount of the product’s life. The HASS process uses rapid thermal transitioning combined with multi-level vibration performed over a frequency bandwidth from 2 Hz to 10 kHz. In addition to these stresses, product-specific stresses, such as voltage margining, frequency margining, and power cycling, are applied.
HALT previously was performed on this product and subsequently the customer requested a HASS screen to be developed. The HASS process included both HASS development and production HASS and used the same accelerated techniques as HALT, but derated.
Product Description and Chronology
The details of the uninterruptible power supply (UPS) product will not be disclosed to protect the customer and product identity. The unit consisted of a metal chassis with the main components being a printed circuit board (PCB), a large transformer, and a battery.
The top plate of the chassis was left off to allow faster thermal change rates to the product. The PCB was mounted to the chassis base via several standoffs.
The system tested was a mature product with many hundreds of units in the field. The product was experiencing random failures occurring at the end-user site. The failure mode resulted in several FETs exploding, rendering the UPS inoperable.
An ESS program had been performed on each UPS prior to shipment. The program consisted of a 50°C burn-in at almost full output loading. This was ineffective in precipitating this failure mode or others.
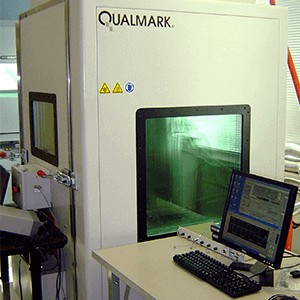
HASS Equipment
The HASS profile was developed, tested, and proven (HASS development) in our lab using the OVS2.5HP HALT/HASS system. The HASS development process included fixture design, fabrication, qualification, profile development, and proof-of-screen. After the development process, the screen was implemented (production HASS) at the customer’s facility on its OVS2.5HP system.
Additional functional test equipment was used to verify the operation of the UPS to its performance specification. This test equipment was located outside of the chamber and cabled via the chamber access port to the units-under-test.
Fixture Design and Qualification
The HASS fixture was designed and fabricated to support the product throughput testing and provide proper vibration transmissibility, thermal uniformity, and a balanced thermal rate of change. Two functional units were secured to the two fixture locations with thermocouples, and accelerometers were attached to each unit to perform thermal and vibration surveys (Figure 1).

Profile Design
The HASS profile was based on the HALT results, along with other product-related variables such as functional test duration, thermal long-term degradation effects (long-term failure modes that may require a reduction of stress levels), product-specific stresses, and production throughput test requirements. The profile consisted of two combined environment cycles performed within the product’s operating limits. The UOL, LOL, and DL values were acquired from the HALT results.
The initial profile levels (rule-of-thumb estimates) were 80% of the cumulative range of the UOL and the LOL. For example, with an UOL of 100°C and LOL of -70°C equaling a 170°C range, 85°C and -53°C were used.
X = [(LOL – UOL) (0.20)] /2
Where: X equaled the margin temperature subtracted from both the LOL and UOL.
Vibration setpoint levels were 50% of the DL, but within the OL, as measured on the product. If the 50% value had exceeded the OL, then 80% of the OL would have been used as the setpoint.
Vibration was modulated throughout, beginning at 3 to 5 Grms and slowly ramped to the maximum level. This process was repeated in reverse, from the maximum level to 3 to 5 Grms.
Dwell times at each temperature extreme began where the products attained the desired temperature, and were held a minimum of 5 minutes during which time the functional tests were run. The vibration modulation ramps were slow, with a 5-minute dwell minimum requirement at the maximum vibration level.
These factors were considered in the design of the profile:
- Thermal UOL: 100°C.
- Thermal UDL: 100°C.
- Thermal LOL: -70°C.
- Thermal LDL: <-80°C.
- Vibration OL: 50 Grms.
- Vibration DL: 50 Grms.
- Functional test length: 2 minutes.
- Production throughput requirement: 3 units per hour.
- Power cycle at each thermal extreme during the dwell.
- Plastic front-panel chassis cover: softens at approximately 90°C.
Considering these factors, the initial designed profile limits were as follows:
- Maximum profile temperature: 83°C.
- Minimum profile temperature: -53°C.
- Maximum profile vibration: 30 Grms.
- Profile duration: 60 minutes.
Product Functional Test Routine
The functional test routine was performed throughout the profile. This consisted of supplying a variable AC input to the units and a variable load on the outputs. The battery charge and battery-line switching circuits also were tested. Power cycling was performed at the thermal extremes.
Proof-of-Screen
Proof-of-screen was a two-step process. It determined how effective the screen was in detecting manufacturing flaws and proved that the screen had not removed significant life from the screened products.
Screen Effectiveness
The screen’s effectiveness was measured by its capability to precipitate latent defects, such as component weaknesses, PCB flaws, circuit timing problems, mechanical tolerance problems, solder defects, and other manufacturing assembly-related issues associated with the manufacturer’s or vendor’s process going out of control.
For this process, units classified as NTF or parametrically marginal functional units would have been preferred. Since NTF units were not available, production units were used.
Two functional production units were seeded with flaws representative of the manufacturing process going out of control, such as a poor solder process or damaged or incorrect component insertion. The seeded flaws were microprocessor pin 24 bent under on both units, capacitor C618 with a lead nicked on both units, and a cold solder joint on a through-hole lead of capacitor C303 on just one unit.
The screen should detect these flaws. If not, it should be modified (increase or decrease severity levels) until it does.
Initial Screen Results
The seeded test units were screened using the programmed profile (Figure 2). This profile subjected the units to temperature cycles from +83C to -53C at an average transition rate of 45C per minute combined with vibration. Vibration was modulated from a setpoint of 5 Grms to 30 Grms. This initial screen produced the following failures:
- The units had a thermal fault occurring at temperatures below -40°C, with the unit losing serial communications. The failure also occurred during HALT, but was not carefully analyzed during the root-cause analysis.The failure was thought to be caused by a small PCB that was going to be replaced with a redesign. However, the results during HASS development indicated that the source of this failure was not the small PCB. This was determined by disconnecting the board and verifying that the failure continued to occur. The true root cause of this failure was undetermined at this time.
- In unit #1, the battery charge circuit was not functioning, and the red LED indicated battery service was needed. This occurred during the ramp from -53°C to +83°C at approximately -35°C on the second cycle. This hard failure remained even at 25°C.
The unit was removed and tested with a battery on the bench. On power-up, it blew FETs Q6, Q11, Q22, and Q26, the identical failure that was occurring in the field.
- Upon completion of the screen, a visual inspection revealed that the seeded flaw C303 had dislodged from the through-hole fillet at the cold solder joint.As a result of these findings, the damaged Unit #1 was replaced with Unit #3, and a second screen was performed using the same profile.

Second Screen Results
- The same thermal issues occurred on Unit #2 as they did during the initial screen at -53°C.
- The load LEDs on Unit #2 were flashing on and off randomly at -53°C during the second cycle. This was a hard failure that remained at 25°C with no vibration. A visual inspection of the unit revealed that a metal-oxide varistor (MOV) component had broken free from the board.
- The damaged Unit #2 was replaced with Unit #4, and a third screen was performed using a slightly modified profile. This profile was programmed with reduced levels. The thermal lower limit was increased to -30°C, and vibration was reduced to 20 Grms. This profile subjected the units to temperature cycles from +83°C to -30°C at an average transition rate of 45°C per minute combined with vibration. Vibration was modulated from a setpoint of 5 Grms to 20 Grms.
Third Screen Results
Both units passed the screen with no failures or anomalies.
Product Life Valuation
This process determined the degree of appreciable life remaining in the products after exposure to the HASS profile. The concept was to repeat the profile many times, without failures occurring, to show that production units exposed to only one pass of the profile would still have 90% minimum of the useful life remaining, or 10% maximum of life removed. For greater confidence, additional repeat cycles could have been performed on these units; however, time did not allow.
Production-level units were used for this process, with both fixture locations populated. The test units were screened using the latest profile, then repeated 10 times. This profile subjected the units to temperature cycles from +83°C to -30°C at an average transition rate of 45°C per minute combined with vibration. Vibration was modulated from a setpoint of 5 Grms to 20 Grms.
Product Life Valuation Results
An inspection of the units following completion of the 20 cycles (one profile = two cycles) revealed that the MOV component RV301 had broken free from the board (both leads were broken at the board) on the upper unit. This failure was not considered of consequence because the customer planned to use room-temperature vulcanizing (RTV) adhesive to support the MOV on future production units.
Summary
The HASS development effort began with designing and qualifying the fixture by measuring the unit’s thermal and vibration responses. Then, the HASS profile was developed using the unit limits determined during HALT, along with other product-specific factors. Remember, HALT was required before HASS could be properly performed.
During the development of the HASS profile, adjustments were made to the profile to optimize its efficiency. These changes were reflected in the final profile shown in Figure 3.

The cold thermal fault problem causing the unit to lose serial communications at temperatures below -40°C needed more evaluation to determine the root cause. Once determined, the profile was expanded and the proof-of-screen rerun. The same was true regarding the RTV adhesive on the MOV. The RTV had to be applied between the MOV and PCB and the product life valuation rerun.
Successful implementation of HALT can dramatically reduce product development cycle time and costs while providing the answers needed to produce a more robust design. Successful implementation of HASS can eliminate infant mortality failures, reduce product support costs, and increase customer satisfaction.
A successful manufacturing program includes:
- Perform HALT to understand and gain information of the product’s capabilities.
- Perform root cause analysis on the HALT failures and implement corrective action.
- Perform HALT again with the new fixes in place.
- Repeat Steps 2 and 3 until the problems are resolved satisfactorily.
- Perform HASS development.
- Perform HASS on production products.
The method of HASS development includes:
- Design and build a fixture that supports throughput and other requirements.
- Perform fixture qualification.
- Create a HASS profile of thermal and vibration stimuli based on the HALT results. In addition to these stresses, apply other product-specific stresses that will test the functional integrity of the product.
- Perform a proof-of-screen process.
- Release the proven profile to begin production screening.
- Monitor the HASS effectiveness over time.
HASS development was not intended to be a rigid process with an endpoint. Rather, it is a living process that may need modification or adjustment over the life of the product. As more is learned about the product over time, including the HASS results, the profile may change and evolve into an even better, more effective screen.


Acknowledgment
I would like to acknowledge Dr. Greg Hobbs as the inventor of the HALT and HASS terms and techniques.